Climate Resilience Dashboard


This page allows you to discuss the spatial and temporal vegetation dynamics across the project area. In the Kenyan drylands, vegetation is strongly goverened by rain. Here you can explore the vegetation-rainfall relation by scrolling through the years and zooming in on different areas.
Select year
Enhanced Vegetation Index (EVI)
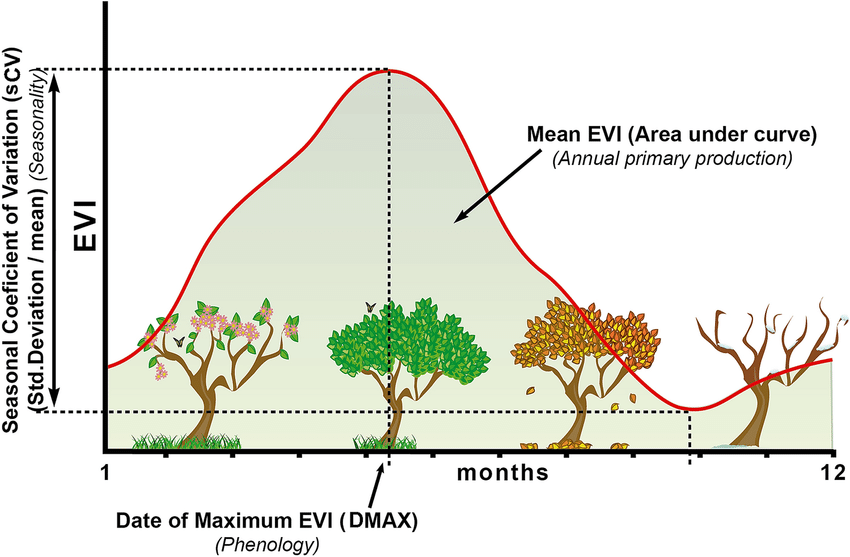
The Enhanced Vegetation Index (EVI) shows how green and healthy vegetation is from satellite images. Higher EVI values mean more green, healthy vegetation, while lower values indicate less vegetation or unhealthy plants. This EVI is derived from the MODIS satellite sensor.
The image below shows how the EVI relates to different phenological stages of vegetation:

Annual rainfall
Rainfall estimates come from the Global Precipitation Measurement (GPM). This is a radar satellite that measures rainfall through radar waves and is calibrated based on numerous ground station acrross the globe.


Funded by:
