Climate Resilience Dashboard
Land health can be defined in many different ways, but it generally refers to the degree to which the integrity of the soil, vegetation, water and air, as well as ecological processes are balanced and sustained. Likewise, there is a wide range of indicators that can be used to assess land health which can be measured in various ways, ranging from detailed ground measurements, satellite imagery or a combination of the two.
All land health data, maps and figures provided on this page are derived from data collected using the Land Degradation and Surveillance Framework, which is a global framework for monitoring land health

Land health indicators were predicted for the TWENDE area using the CIFOR-ICRAF database which was complemented with an extensive data collection campaign in the TWENDE area. Based on these data, satellite imagery, and machine learning, indicators such as SOC, tree cover, erosion and pH were predicted for the TWENDE area and aggregated by county, sub-county and ward. This page shows the results of these predictions and allows you to explore the results interactively.
Vegetation trends give insights in greening or browning trends in a landscape. These trends can be detected using satellite-derived vegetation indices, such as the Normalized Difference Vegetation Index (NDVI). Tough, the drivers of greening and browning trends are divers and can include natural rain cycles, deforestation, land use change, fires or other natural or human-induced events.

The Land Degradation and Surveilance Framework (LDSF) is a global framework for monitoring land health developed by CIFOR-ICRAF. It is based on a wide set of indicators that are collected at multiple spatial scales. For the TWENDE project area, data was collected at 1000? LDSF plots which can be explored at this page. To learn more about the LDSF, you can visit the website.

Advanced methods were used to analysis the LDSF data and to produce the land health maps. This page provides more information on these methods and on some of the concepts used to assess land health.
SOC is a key indicator of soil health. SOC influences the water holding capacity of the soil, cation exchange capacity, soil productivity, among other key soil properties. In addition, SOC is influenced by land management practices and aboveground vegetation. A value of 20 g carbon per kg of soil, is often used as a general threshold needed for agricultural productivity. Therefore, soil with values less than this threshold could be considered constrained due to low SOC content. If SOC values fall below 10 g Carbon per kg of soil, SOC will represent a major constraint to productivity.
Trees protect soil from erosion, provide habitat for biodiversity, and contribute to carbon sequestration. While high levels of tree cover can indicate a health ecosystem, it is not directly realated to soil health and can even decrease soil health if unsuitable tree species are dominant.
The prevalence of erosion and root-depth restrictions (i.e. compaction) are key indicators of land degradation status and land health in drylands. Inappropriate agricultural practices or high grazing pressure can lead to reduced water capacity capacity into the soil and increased risk of soil erosion.
Soil erosion also influences a range of other indicators of land health, including soil health through the removal of topsoil (and hence SOC), and vegetation cover and diversity through the loss of vital seed stocks. Areas that are strongly eroded will therefore often not respond to available rainfall and are generally more difficult (and costly) to restore once degraded. Compaction through, for example, use of machinery or intensive grazing and trampling by animals also tends to increase erosion, as well as inhibit the growth of plants.

Soil pH is an indicator of soil acidity. At low soil pH values (< 5.5) there is a risk of aluminum and magnesium toxicity. At high soil pH (> 8.3), there can be induced phosphorous and micronutrient deficiency which may also indicate high sodium levels.
Biodiversity loss is an important process of land degradation that influences a range of different ecosystem functions, including:
1. Productivity (e.g. soil biodiversity)
2. Ecosystem predictability and resilience to climate change
3. Carbon cycling processes

Land health indicators were predicted for the TWENDE area using the CIFOR-ICRAF database which was complemented with an extensive data collection campaign in the TWENDE area. Based on these data combined with satellite imagery and machine learning, indicators such as SOC, tree cover, erosion and pH were predicted for the TWENDE area and aggregated by county, sub-county and ward. This page shows the results of these predictions and allows you to explore the results interactively.
Set transparency
Press to show graph
Explore the landscape interactively below!
These maps show the soil organic carbon, tree cover, erosion and pH across the TWENDE project area for the year 2022-2023. They were created using the CIFOR-ICRAF soil and vegetation database which contains thousands of ground measurements in- and outside Kenya. By combining these ground data with Landsat 8 satellite images and machine learning, we can make accuracte maps of these ecosystem indicators for large areas.
By selecting a district or ward in the left panel, the map will automatically zoom to the selected area.
This graph shows the selected land health indicator (SOC, tree cover, erosion and pH) for the selected sub-county and ward. The green, orange and red dashed lines indicate what we consider 'healthy', 'medium' and 'degraded' levels for each indicator. Generally, healthy ecosystems are associated with higher SOC and tree cover, lower erosion and neutral (~6.5) pH levels. The blue dashed line represents the county-average for that indicator.

plot_explanation
Select a zoom level of interest to see the land health indicators across regions.
The plots show the average SOC, tree cover, erosion and pH across regions, based on the selected zooming level. The green, orange and red dashed lines indicate what we consider 'healthy' levels for each indicator. Generally, healthy ecosystems are associated with higher SOC levels and tree cover, lower erosion and neutral (~6.5) pH levels.


The Land Degradation and Surveilance Framework (LDSF) is a global framework for monitoring land health and was developed by CIFOR-ICRAF. It is based on a wide set of indicators that are collected at multiple spatial scales across the landscape (see figure right). The LDSF has been used in over 40 countries across the tropics to monitor land health comprehensively. To learn more about the LDSF, you can visit the website or have a look at the field manual which includes a detailed description of the framework.
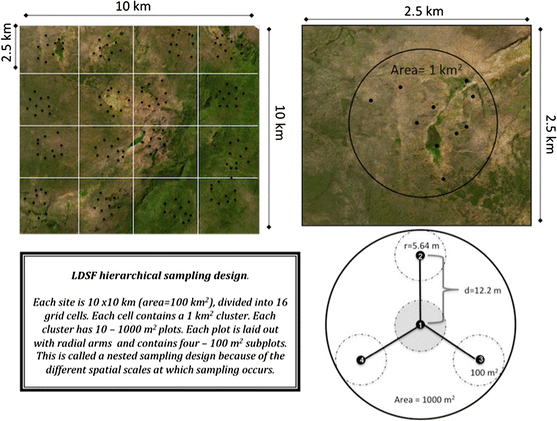

For the TWENDE project, field data was collected at three LDSF sites at 492 sampling locations (see map right). These data capture the large differences between the three TWENDE landscapes, but show also considerable variation within the sampling sites. The data collection was performed in 2023 by field teams trained by CIFOR-ICRAF and together with the local communities.
One LDSF site was established in each of the three TWENDE landscapes:
1. Laisamis site (Sabarwawa landscape)
2. Mbalambala site (Mid-Tana landscape)
3. Mbirikani site (Chyulu landscape)

Species diversity is crucial for a healthy ecosystem. A higher species diversity in a landscape leads to improved productivity, resillience and more. The LDSF has a strong focus on biodiversity and captures tree, shrub, grass, herb and forb diversity at each sampling location.
You can explore the species data that was collected at the TWENDE LDSF sites by setting your indicator/area of interest.
Press to update graph

What happens below the ground is at least as important for an ecosystem as what happens above ground. A healthy soil is crucial to regulate carbon and water cycles, sustain plant growth, provide nutrients and much more. Soil samples were taken and analysed in the CIFOR-ICRAF lab in Nairobi on key properties such as soil organic carbon, nitrogen, pH and sand/clay content.
You can select an indicator of your interest and see how the soil properties vary across the sampling locations.

Land health indicators were predicted for the TWENDE area using the CIFOR-ICRAF database which was complemented with an extensive data collection campaign in the TWENDE area. Based on these data combined with satellite imagery and machine learning, indicators such as SOC, tree cover, erosion and pH were predicted for the TWENDE area and aggregated by county, sub-county and ward. This page shows the results of these predictions and allows you to explore the results interactively.

TEXT


Funded by:
